Detecting Manipulations in Data with Benford's Law – a C# class
By Kerry Cakebread (CP member) and Amy Cakebread (math guru)
Introduction
If you have ever taken a statistics class, at some point you undoubtedly had a homework assignment to flip a coin a few hundred times and record the results for a class experiment the next day. Think back—were you tempted perhaps to take a short cut and just scribble some results down ("H/T/H/T/H/T") without actually flipping that annoying coin? Well, of course—it's only natural for students to take shortcuts when they think they can get away with it. Besides, you know the expected result, right? There are bound to be equal numbers of heads and tails… Maybe you even thought you'd be clever and mix the results around a little so they look believable.Well… what if we told you that using just the results and a mathematical phenomenon known as Benford's Law, we could pick out the cheaters from a room full of bored statistics students? Read on, and we'll show how this rare bit of magic can be not only surprising, but surprisingly useful as well. In fact, we'll give you a C# class and sample application so you can experiment with data sets of your own.
You see, Benford's Law is a mathematical theorem useful in detecting the presence of fraudulent or artificially created numbers within certain types of data. The law predicts that the first digit (or first two digits) of each number in such a data set will occur with a frequency that conforms to the logarithmic scale or distribution. In other words, the first digit of each number in the series will be a "1" more often than it will be a "2", which will be more often than it will be a "3", and so on with very specific decreasing frequencies. How well a sample set conforms to the predicted values can be evaluated by a variety of statistical "goodness of fit" tests, such as Pearson's chi-square.
Specifically, Benford's Law uses a logarithmic distribution to determine the probability of getting a significant digit p(d)=![]() for the digit d=1, 2,…, 9 within certain kinds of data sets. For example, the probability of having the first digit of a number be one is
for the digit d=1, 2,…, 9 within certain kinds of data sets. For example, the probability of having the first digit of a number be one is ![]() or approximately 30.1%. It so happens that this formula also works for successive digits, for example the probability that the first two digits of a number are 32 is
or approximately 30.1%. It so happens that this formula also works for successive digits, for example the probability that the first two digits of a number are 32 is ![]() , or approximately 1.3%. The table below shows the probability of getting the first significant digits from 1 to 9.
, or approximately 1.3%. The table below shows the probability of getting the first significant digits from 1 to 9.
Valid data sets for this type of analysis are those which are the result of natural processes and diverse influences. Naturally occurring data such as changing valuations in stock markets, lists of accounts receivable or payable, the sizes of geographical features, and addressed street numbers are just a few of the naturally occurring datasets that surround us.
However, not all data conform to Benford's Law. For example, if you take the age of all students in a high school class you will have the leading digit 1 appearing 100% of the time—this clearly does not conform to Benford. Similarly, if your data set happens to be the phone numbers in the Portland-area phone book, no number 1s appear (since the area code is 503); hence, the probability of getting a 1 as a first digit of this data set is 0%, not the 30% anticipated by Benford. Also, lottery numbers do not display a Benford distribution because they are random—every number has an equally likely chance of occurring. Hence, uniform distributions are specifically excluded. Data sets which are valid for Benford study are data that are not random (such as the lottery or fair dice) or subject to heavy constraints such as ages of patients in a nursing home.
One could easily envision the further applicability of this law in other types of signal processing, for example, error-checking in data transfers or in searches of astronomical radio data. Most recently, Benford's Law has become an auditor's tool, enabling a quick scan of accounts or ledgers to identify those which may require a closer look.
| d | p(d) |
| 1 | .301 |
| 2 | .176 |
| 3 | .125 |
| 4 | .097 |
| 5 | .079 |
| 6 | .067 |
| 7 | .058 |
| 8 | .051 |
| 9 | .046 |
Background
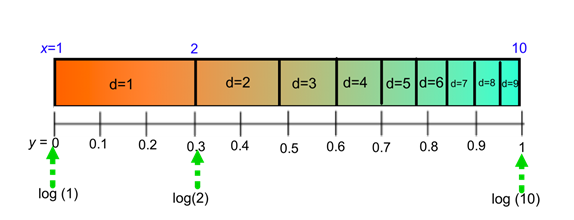
In 1881, the astronomer and mathematician Simon Newcomb published an article in which he claimed, "[That] the ten digits do not occur with equal frequency must be evident to any one making much use of logarithmic tables, and noticing how much faster the first pages wear out than the last ones". For tables of logarithms to be more frequently used to access lower digit values implies that people dependent on those tables are more likely to need to look for the numbers whose first digits are 1, 2, 3 and are less likely to need to look up number that begin 9, 8 and 7. Newcomb was the first mathematician to recognize the behavior, suggest an explanation and recognize it as an instance of a more generalized phenomenon.
Almost 60 years later, independent of Newcomb's publication, General Electric physicist Frank Benford published a paper detailing his observations of the use of the logarithm tables. His article was the first to develop and propose an equation to model this phenomenon, now known as Benford's Law. Although both men used the logarithmic nature of naturally occurring numbers as the basis of their observations, Benford was able to generalize his equation to model any first significant digits of a number whereas Newcomb focused on only the first two digits. In fact, Benford collected over 20,000 discrete data sets to create his equation and justify his argument.
In the last 50 years, over 150 articles have been published about Benford's Law, many of which detail the diversity of its possible applications.
Beginning with Newcomb in 1881, many people have attempted to explain and prove why Benford's Law accurately predicts the first significant digits of naturally occurring data. However, a robust mathematical proof eluded researchers until relatively recently.
Indeed, though Newcomb was the first to attempt to explain this phenomenon in mathematical terms, his efforts fell short of offering a proof in that he did not suggest an equation to model the data. Benford later provided such an equation, but his attempt did not actually yield a valid proof. In the years since these pioneers' attempts, many other strategies have been employed to describe this phenomenon mathematically. Some have made arguments based in number theory, integration techniques, or scale- and base-invariant arguments relying on the assumption of continuity. Still others have employed statistical techniques.
Having reviewed all the proofs we could find, the most accessible and quickly understood was provided by Jon Walthoe (1999), in our opinion. You can refer to the references at the end for further reading about robust mathematical proofs for the phenomenon.
Using the code
Included, you will find two projects: a class library (BenfordAnalysis.DLL) and a sample application (BenfordSampleApp.exe). The executable is a straightforward demonstration of how to use the BenfordAnalyzerObject class hosted in the DLL. It provides a DataViewGrid for entry of values to be tested, as well as buttons below to load a provided sample set of data (March 2011 expenditures of the British Government's Science and Technology Facilities Council), generate 1000 random numbers to be tested, or clear the entry grid.
The sample application also provides a second DataViewGrid to view the results of Benford analysis. Here, you will find rows corresponding to the digits 1-9 and columns indicating the frequency of occurrence for each digit, the expected occurrence, and statistics which measure the magnitude of the error. Finally, below the analysis grid, a set of labels provide aggregate information about the analysis, including the results of a Person's chi-square "goodness of fit" test. (Our thanks to the contributors to the GNU-licensed Cephes Math Library for the chi-square implementation—see code comments).
After loading or entering a dataset into the raw data grid, clicking the analyze button will create an instance of a BenfordAnalyzerObject, call the Analyze() method, and use the object's properties to fill the analysis grid and labels.
        private void Analyze_Click(object sender, EventArgs e)
        {
            try
            {
                BenfordAnalyzerObject benfordObj = new BenfordAnalyzerObject();
                benfordObj.Analyze(RawData);
                AnalysisGrid.DataSource = benfordObj.AnalysisDataTable;

                MSD.Text = benfordObj.MeanSignedDeviation.ToString();
                MAD.Text = benfordObj.MeanAbsoluteDeviation.ToString();
                MAPE.Text = benfordObj.MeanAbsolutePercentError.ToString();

                X2.Text = Math.Round(benfordObj.ChiSquareTestValue, 2).ToString() +
                    string.Format(" (P = {0})", Math.Round(benfordObj.PValue, 4));
            }
            catch (Exception ex)
            { MessageBox.Show("An error occurred: " + ex.Message); }

        }
Within the BenfordAnalyzerObject class, there is a single public method Analyze(DataTable), which also provides an override so that the caller can specify the column name to be used (the default is "Value").
public void Analyze(DataTable rawDataTable)

public void Analyze(DataTable rawDataTable, String valueColumnName)
This method begins by doing simple verification of the argument table (absolute value of numeric values 1-9) and assigning the first digit of each number to its own column.
After verifying the input data, the method constructs a DataTable to hold the analysis results and fills its columns with the indicated statistical measures: Count, ExpectedCount, SignedDifference, Frequency, ExpectedFrequency, AbsoluteDifference, and AbsolutePercentError. Two additional expression columns in this DataTable provide foundational data for calculation of the chi-square statistic: the square of the difference between the expected and observed value (SqDiff), and the square difference divided by the expected value (SqDiffOverE).
private void InitializeAnalysisTable()
        {
            _analysisDT = new DataTable();
            _analysisDT.Columns.Add(DigitColumn);
            _analysisDT.Columns.Add(CountColumn, typeof(Int32));
            _analysisDT.Columns.Add(ExpectedCountColumn, typeof(Int32));
            _analysisDT.Columns.Add(FrequencyColumn, typeof(Decimal));
            _analysisDT.Columns.Add(ExpectedFrequencyColumn, typeof(Decimal));
            _analysisDT.Columns.Add(SDColumn, typeof(Decimal));
            _analysisDT.Columns.Add(ADColumn, typeof(Decimal));
            _analysisDT.Columns.Add(APEColumn, typeof(Decimal));
            _analysisDT.Columns.Add(SqDiffColumn, typeof(Decimal), String.Format("{0} * {0}", SDColumn));
            _analysisDT.Columns.Add(SqDiffOverEColumn, typeof(Decimal), String.Format("{0} / {1}", SqDiffColumn, ExpectedCountColumn));
        }

            //for each leading digit 1-9 (could easily be modified to analyze first 2 digits 10-99)
            for (Byte digit = 1; digit <= 9; digit++ )
            {
                count = (Int32)_rawDataTable.Compute(String.Format("COUNT({0})", ValueColumn), String.Format("{0} = {1}", FirstDigitColumn, digit.ToString()));
                frequency = Math.Round(((Double)count / (Double)rawRowCount), 2);
                expectedFrequency = Math.Round(Math.Log10( 1 + (1.0 / digit) ), 2);
                expectedCount = (Int32)Math.Round(expectedFrequency * rawRowCount, 0);

                sd = count - expectedCount;
                ad = Math.Abs(sd);
                ape = ad / expectedCount;

                //add a row to our analysis table with the calculated values
                _analysisDT.Rows.Add(digit, count, expectedCount, frequency, expectedFrequency, sd, ad, ape);
            }
The public properties which follow provide access to the analysis DataTable itself as well as aggregate calculated values, such as MeanSignedDifference, MeanAbsoluteDifference, MeanAbsolutePercentError, Chi-square test statistic, and Chi-square P value. It is beyond the scope of this article to discuss calculating or interpreting Pearson's chi-square statistic in detail, or to examine why chi-square was selected to evaluate this distribution, but information about these topics is readily available through further reading of the selected references (below). Suffice it to say that a P-value > .05 (for example) would be considered a statistically significant correlational fit between observed and predicted values.
        public DataTable AnalysisDataTable
        {
            get { return _analysisDT; }
        }

        public Double MeanSignedDeviation
        {
            get { return Convert.ToDouble(_analysisDT.Compute(String.Format("AVG({0})", SDColumn), "")); }
        }

        public Double MeanAbsoluteDeviation
        {
            get { return Convert.ToDouble(_analysisDT.Compute("AVG(AD)", "").ToString()); }
        }

        public Double MeanAbsolutePercentError
        {
            get { return Convert.ToDouble(_analysisDT.Compute("AVG(APE)", "").ToString()); }
        }

        public Double ChiSquareTestValue
        {
            get { return Convert.ToDouble(_analysisDT.Compute("SUM(SqDiffOverE)", "")); }
        }

        public Double PValue
        {
            get { return SpecialFunction.chisqc(8, ChiSquareTestValue); }
        }
References and Selected Reading
- http://mathworld.wolfram.com/BenfordsLaw.html
- https://dspace.library.uvic.ca:8443/bitstream/handle/1828/3031/Thesis.pdf?sequence=1
- Becker, T.J. (2000). Sorry, Wrong Number: Century-old math rule ferrets out modern-day digital deception. Research Horizons Volume 18(1). Retrieved from http://gtresearchnews.gatech.edu/reshor/rh-f00/math.html
- Benford, F. (1938). The Law of Anomalous Numbers. Proceedings of the American Philosophical Society 78, 551-572.
- Browne, M.W. (1998, August 4). Following Benford's law, or looking out for No.1. The New York Times. Retrieved from http://www.nytimes.com
- Diekmann, A. (2007). Not the First Digit! Using Benford's Law to Detect Fraudulent Scientific Data. Journal of Applied Statistics 34(3), 321-329. ISSN:0266-4763.
- Durtschi, C, Hillison, W and Pacini, C (2004). The effective use of Benford's law to assist in detecting fraud in accounting data. Journal of Forensic Accounting 1524-5586/Vol. V, 17-34.
- Geyer, CL and Williamson, PP (2004). Detecting Fraud in Data Sets Using Benford's Law. Communications in Statistics: Simulation and Computation 33(1), 229-246. ISSN:0361-0918.
- Hill, TP (1998). The First-Digit Phenomenon. American Scientist 86 (4), 358-363. ISSN:0003-0996.
- Hill, TP (1995). A Statistical Derivation of the Significant-Digit Law. Statistical Science 10(4), 354-363. ISSN:0883-4237.
- Hill, TP (1995). The Significant-Digit Phenomenon. American Mathematical Monthly 102(4), 322-327. ISSN:0002-9890.
- Hill, TP (1995). Base-Invariance Implies Benford's Law. Proceedings of the American Mathematical Society 123(3), 887-895. ISSN:0002-9939.
- Kafri, O (2009). Entropy Principle in Direct Derivation of Benford's Law. arXiv:0901.3047v2.
- Newcomb, S (1881). Note on the frequency of use of the different digits in natural numbers. American Journal of Mathematics 4(1), 39-40.
- Nigrini, MJ (1999). I've got your number. Journal of Accountancy 187(5), 79-83.
- Nigrini, MJ (1999). Adding value with digital analysis. The Internal Auditor 56(1), 21-23.
- Raimi, RA (1976). The First Digit Problem. American Mathematical Monthly 83(7), 521-538. ISSN:0002-9890.
- Walthoe, J. (1999, September 1). Looking out for number one. Plus Maths, (9), Retrieved from http://plus.maths.org/content/looking-out-number-one
 "
"